Debugging with Nsight
As of the latest version of NVIDIA's Nsight (4.0 I believe), it is able to
attach to chrome's GPU process and let us debug/
Here is what's needed to get it working:
-
Nsight 4.0, Visual Studio and an NVIDIA GPU are required. There is an Eclipse version of Nsight but it has not been tested.
-
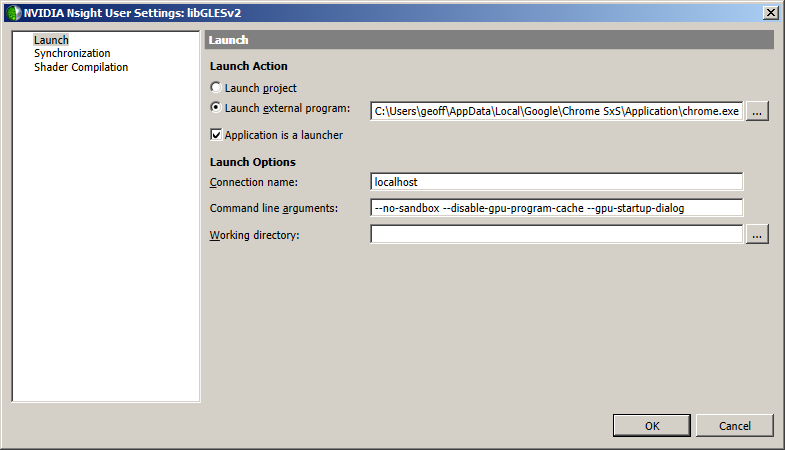
Open any project in Visual Studio (just needs to be something to "run"), right click the startup project and select Nsight User Properties.
-
Set the radio box to "Launch external program", check "Application is launcher" (this is the new feature as of 4.0) and set the command line arguments to at least --no-sandbox --disable-gpu-watchdog and --gpu-startup-dialog. --disable-gpu-program-cache is optional; if you use it, you're able to step through the shader source lines, otherwise only the disassembly is available.
-
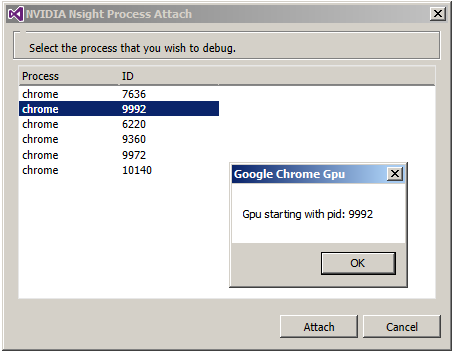
From the NSIGHT menu in Visual Studio, select "Start Graphics Debugging". Wait until the gpu startup dialog shows up and connect to it.
-
Navigate to any page you wish to debug. The Nsight HUD doesn't seem to be interactive with chrome though.
-
When you want to debug a frame, go to the NSIGHT menu in Visual Studio and select "Pause and Capture Frame".
-
Nsight will open a few overlays on top of chrome that let you step through the frame (check the taskbar, sometimes they appear behind chrome).
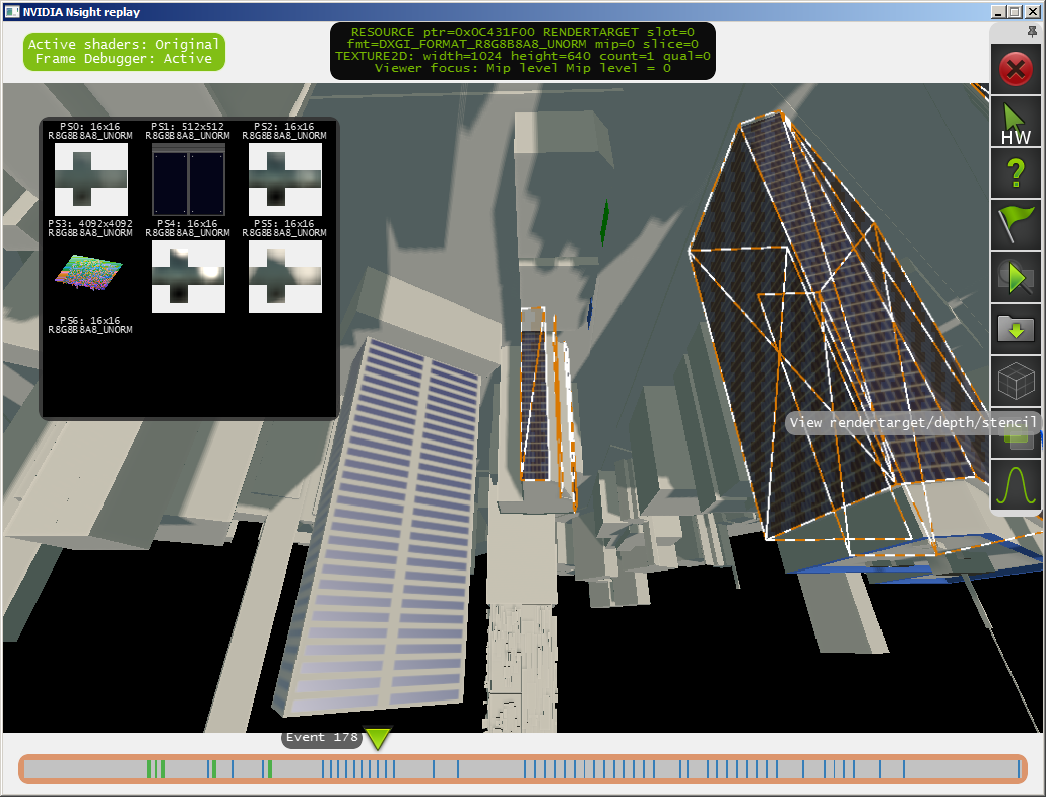
-
It will also open some new windows in Visual Studio for viewing the current D3D/
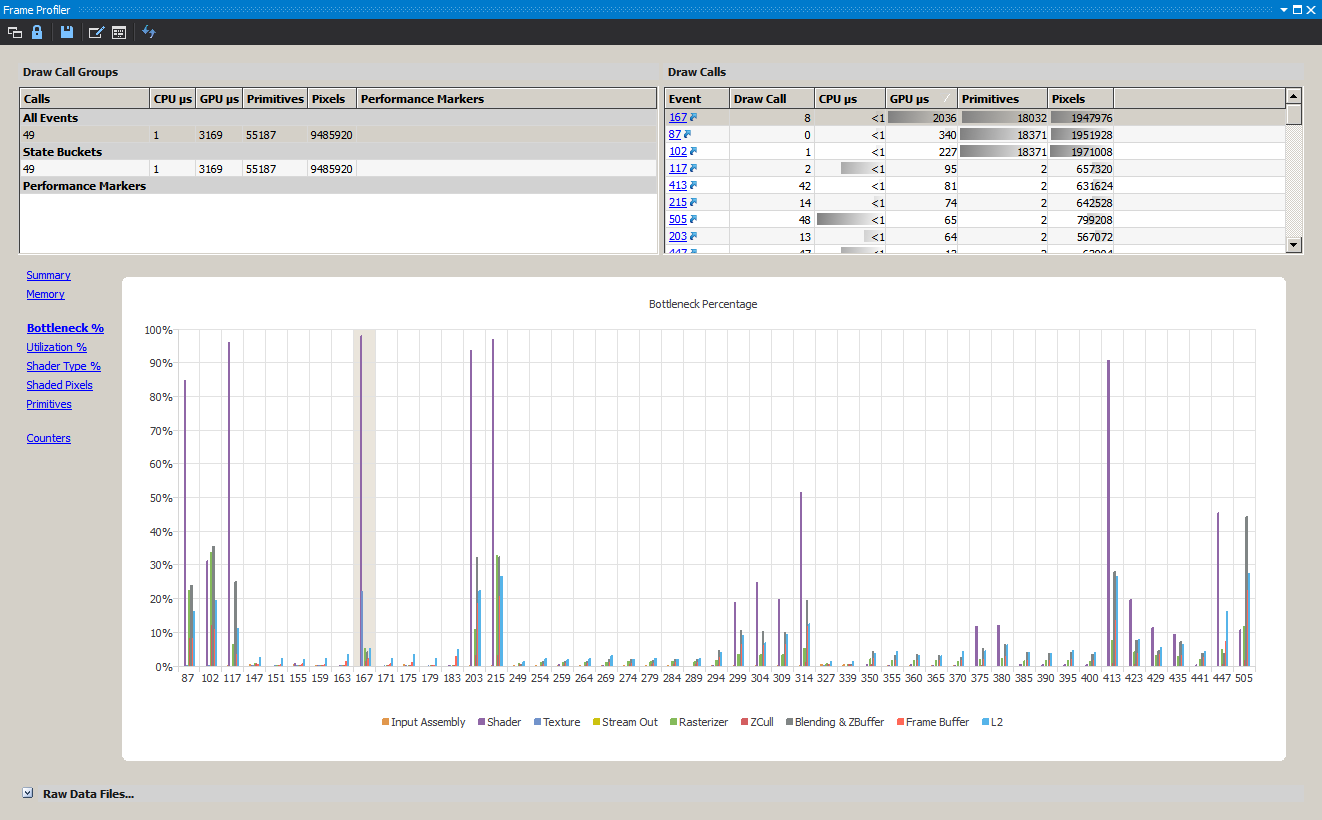
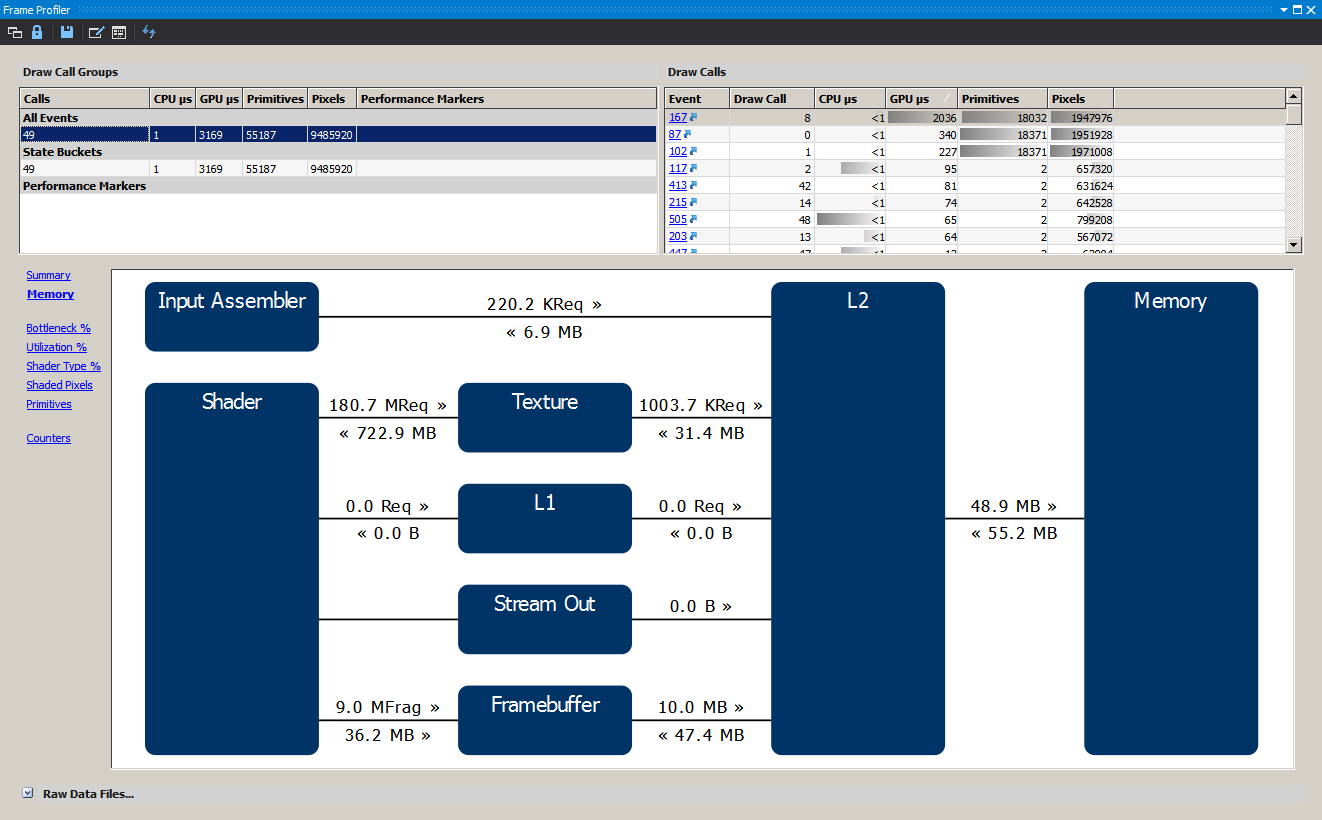
GL state and allocated GPU resources, stepping through the shaders for debugging (recently caught a HLSL shader optimization bug this way), profiling the CPU/ GPU speed of each call and finding out what kind of bottlenecks we're hitting (input assembly, pixel/ vertex shader, texture fetch, blend, etc).